1. Normal Distribution
- Unimodal(단봉형)
- Symmetric(대칭)
정규분포 그래프는 N(μ,σ)를 만족하며 μ는 평균, σ는 표준편차인 그래프를 의미합니다.
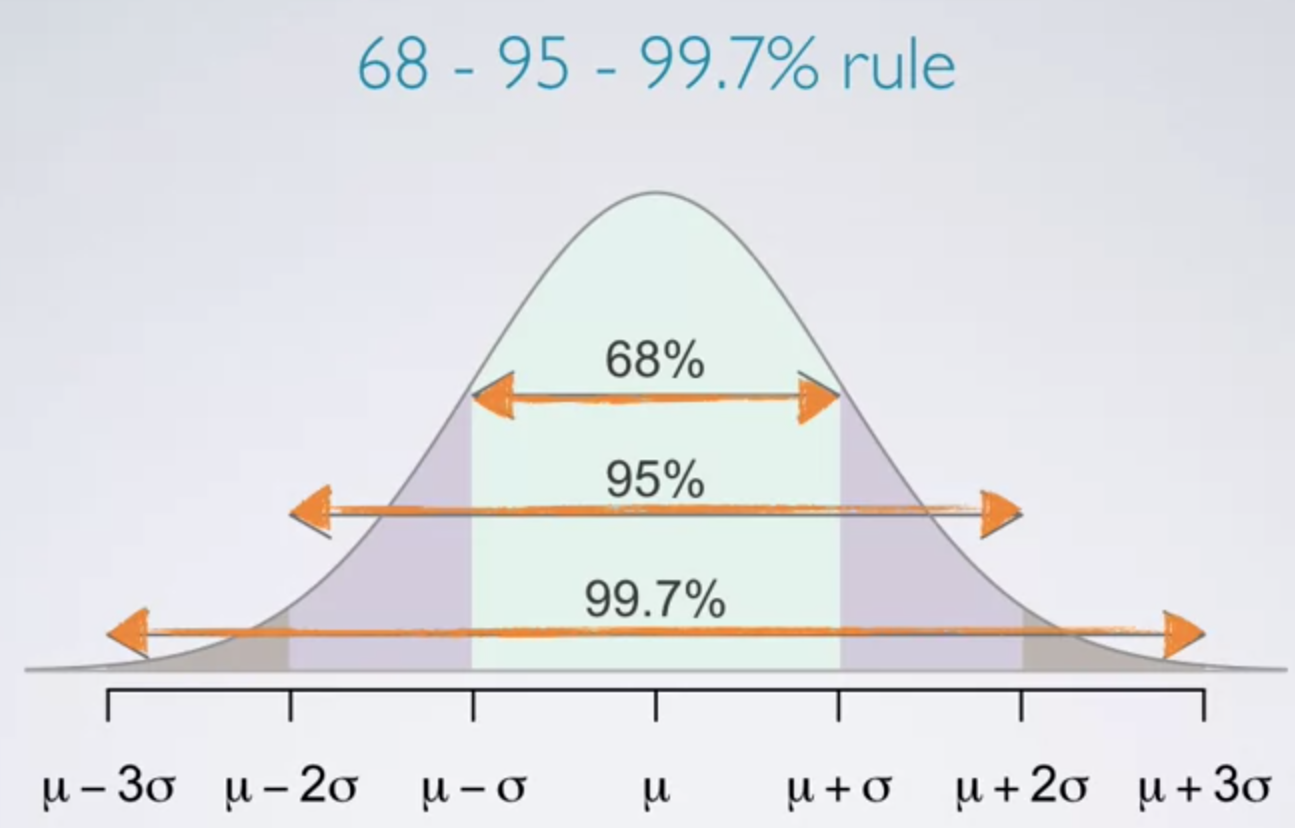
정규분포를 그리는 그래프에서는 아래 그림과 같이 평균을 기준으로 (1 * σ) 범위 내에는 68%의 데이터가 존재하고,
(2 * σ) 범위 내에는 95%의 데이터가, (3 * σ 범위) 내에는 99.7%의 데이터가 존재합니다.
2. Standardizing with Z scores
Z score란 관측치에서 평균을 뺀 뒤 표준편차로 나눈 것으로, 관측치가 평균에서 얼마나 떨어져있는지 표준편차를 사용하여 확인하는 방법입니다. |Z| > 2 * σ라면 이상 관측치로 분류할 수 있습니다.
Z = (observation - mean) / standard deviation
3. percentile : percentage of observations that falls below a given data point
4. Normal Probability Plot

Normal Probability Plot은 오른쪽 그래프와 같이 데이터의 분포가 정규분포를 얼마나 따르는지 확인할 수 있는 그래프입니다. 데이터의 분포가 정규분포를 만족할수록 그래프는 직선에 가깝게 됩니다. x축은 theoretical quantile, y축은 관측치입니다.

위의 그림과 같이, Normal Probability Plot을 통해 그래프의 분포도를 유추해볼 수 있습니다.
5. Binomial Distribution
: the binomial distribution describes the probability of having exactly k successes in n independent Bernouilli trials with probability of success p

- Mean and Standard Deviation of binomial distribution :

-Bernoulli random variable : when an individual trial has only two possible outcomes.
6. Normal approximation to binomial
: as samples size increases, the binomial distribution looks much similar to the normal distribution.
이 특성을 사용하여, 큰 sample size의 binomial distribution에 대해 normal distribution에 사용하는 방법과 마찬가지로 percentile을 구할 수 있다. 이 sample size의 크기는 아래와 같은 조건을 만족할 때 Normal Distribution과 같은 방법을 사용할 수 있다.
* 이 때 0.5정도의 관측치 조정을 통하여 정확한 값을 구할 수 있다.(70이상의 값은 70을 정확히 포함하지 않으므로 0.5를 빼서 Z score를 구한다.)

- Binomial Conditions :
1) The trials must be independent
2) the number of trials, n, must be fixed
3) each trial outcome must be classified as a success or a failure
4) the probability of success, p, must be the same for each trial
'데이터 사이언스 > Introduction to Probability and Data' 카테고리의 다른 글
| Introduction to Probability and Data_Week3 - R Coding (0) | 2019.08.04 |
|---|---|
| Introduction to Probabillity and Data - Week 3 (0) | 2019.07.28 |
| Introduction to Probability and Data(2) - R Coding (0) | 2019.07.26 |
| Introductions to Probability and Data (2) (0) | 2019.07.10 |
| Introduction to Probability and Data - 교재 학습(1) (0) | 2019.07.03 |